ResourceListener: many endpoints, many requests
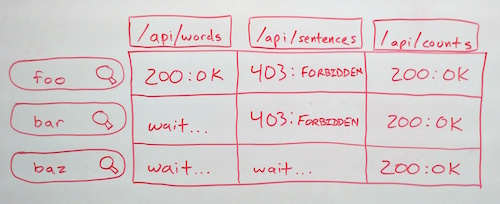
While building the new MediaMeter Dashboard tool, the team at the MIT Center for Civic Media faced an interesting design challenge: keeping track of multiple requests to each of multiple API endpoints and rendering views when the right data is ready. For more context, we designed the Dashboard as a front end for the Media Cloud API from Harvard's Berkman Center. We wanted users to be able to enter several searches and compare the results in many different ways (e.g. result count over time, word frequency, text snippets). What's more, we wanted the tool to be extensible, so it was easy to add new visualizations or accommodate new API endpoints. So we're creating a request for every search/endpoint combination, and each visualization could potentially depend on any combination of them. To make all these requests manageable, I augmented backbone.js's built-in events with a ResourceListener class.
ResourceListener is based on the EventAggregator pattern. A single object aggregates all events related to API requests. All of the different visualizations can then listen to that object for resource-related events, rather than listening to specific models and collections directly. To use the ResourceListener, you need to add a "resourceType" attribute when defining models or collections. Then, after creating the models, simply pass them to the ResourceListener's listen() method. Every time a request is made, the ResourceListener will fire a "request" event and pass the model or collection as a parameter. When the request completes, the ResourceListener will fire a "sync" event, again passing the model as an object. If your only interested in responses from a particular endpoint, you can instead listen to "sync:type" events, where "type" is the "resourceType" attribute of the model or collection. The ResourceListener also fires "resource:complete:type" events when all resources of a particular type are complete, and a "resource:allComplete" when all resources of all types have finished. By passing the ResourceListener object to your views, you can then listen for exactly the events you need, and render as soon as they're complete, without waiting for other requests.
ViewManager: Persistent Views in Single-Page Web Apps
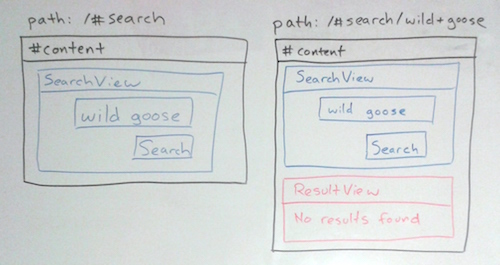
JavaScript frameworks like backbone.js make it easy to create web app content based on the path using Router and View objects. But what if you want some views, and their state, to persist across certain routes? That can be tricky, so I created a simple ViewManager class to take care of the hard parts.
For a concrete example, consider an application that shows a search form (SearchView) and displays the results (ResultView) when it's submitted. You might want to keep displaying the search form along with the results, in case the user wants to modify their search (this is exactly the case that inspired ViewManager while I was working on MediaMeter Dashboard). Following best practices for single-page apps, you put the search results under a different path from the blank search form to allow links directly to the results. But now it gets complicated. If the user gets to the results from the search page, the SearchView already exists, but if the user is coming from a link, the SearchView needs to be created. Same route, different behavior based on the previous route. One approach would be to remove and destroy all views and create them anew every time the route changes. But on top of potentially hindering performance, creating a new view every time destroys useful View state, for instance: whether components of the view are expanded or collapsed.
ViewManager makes it easy to persist views across routes by providing a factory to create views when needed, and a method to automatically hide/show views (similar to the d3.js general update pattern). The getView() factory method takes a View constructor as an argument and either returns the existing view of that class, or creates a new one. The client code doesn't need to keep track of which views already exist, just always call getView() and you don't have to worry about creating duplicates.
The showViews() function is the other half of ViewManager. This function takes a list of views to display, hides any existing views not in the list, and adds any new views that aren't already displayed. If one of the views is already displayed, it won't be recreated and all of the DOM elements will maintain their state. This functionality is also really helpful if you want to add a fade or slide transition when a view is shown or hidden, but don't want to trigger it on route changes.
Data Sculpture: Media Perspective
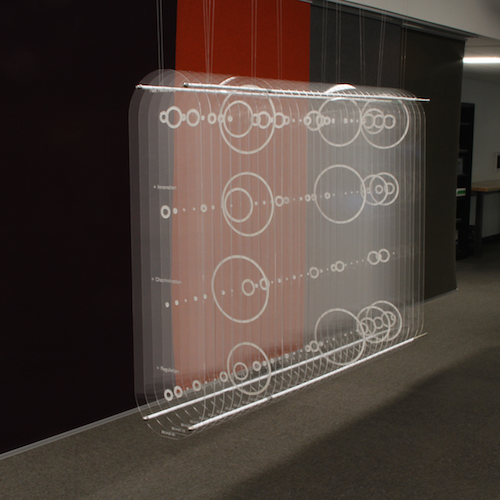
For those of us who work with data, we get used to visualizing in our mind and develop an intuition for it. For everyone else, data visualization usually takes the form of a diagram on a small, two-dimensional screen. Standard data plots can take an exciting idea and turn it into something boring, or even worse, drudge up memories of panicked high school math exams. This experimental data sculpture attempts to draw the viewer into the visualization and connect them with the data on an intuitive, physical level. The sculpture shows the amount of coverage the U.S. mainstream media gave to Net Neutrality between January 2014 and April 2015, while the FCC was creating revised Net Neutrality rules. Each of the 33 panes of clear acrylic represents a two-week time slice, with the size of an etched circle corresponding to the amount of coverage. The top row shows total Net Neutrality coverage, with the other three rows representing coverage of "innovation," "discrimination," and "regulation," in reference to Net Neutrality.
Attention peaks four times: when the FCC announces its proposal, at the end of the public comment period, after President Obama announces support for reclassifying broadband, and finally when the FCC releases its new regulations. Coverage is notably low during the public comment period, the primary time individual citizens had a chance to influence the policy. The visualization also shows that "discrimination," language used in earlier technical and legal discussion of Net Neutrality disappeared from mainstream media coverage, giving way to the more idealogical and economic terms "innovation" and "regulation." The viewer can explore these data by walking around the sculpture, standing back, or standing close, making it easy to engage without a digital interface or specialized knowledge.
Cross-posted to MIT Center for Civic Media
Mooring Hitch on a Slipknot

Here's a fun knot I worked out. It's essentially two slipknots securing each other. It forms a secure, single loop, and can be quickly released by pulling on the working end. I'd be interested to know if anyone has seen it used or know if it has another name. Warning: I'm not endorsing this knot as being useful for any particular purpose, use at your own risk.
Tying Instructions
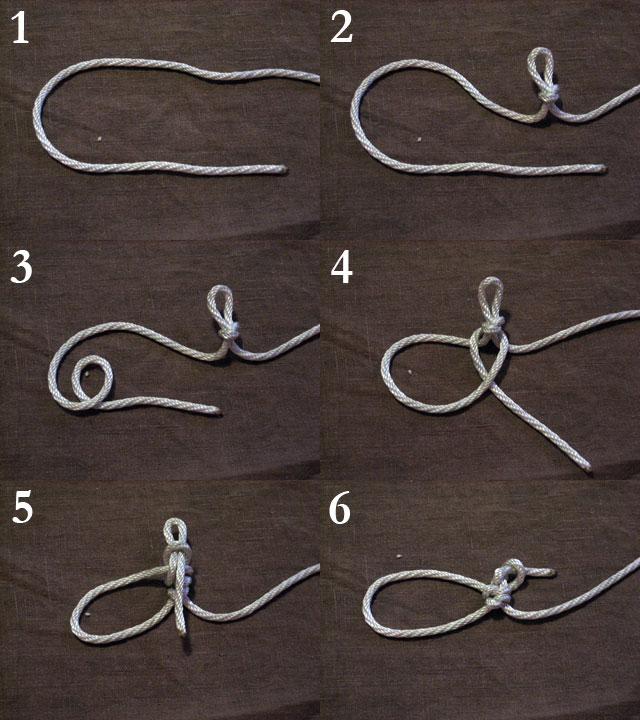
- This is a knot, get some rope.
- Tie a slipknot.
- Form a single turn by passing the working end behind itself.
- Pass the turn over the slipknot forming a large loop.
- Pull a bight of the working end through the loop of the slipknot, creating the loop of a second slipknot.
- Tighten the large loop to secure the knot. To prevent accidental release, pass the working end through the loop of the second slipknot.
- To release, pull the working end back through the second slipknot and tug perpendicular to the standing part.
Update: Thanks to the friendly folks on the International Guild of Knot Tyers Forum, I've been able to identify this as a variant of the Mooring Hitch. The bight in the standing end is replaced by the loop of a slipknot, which fixes the position of the knot on the standing end, allowing it to function as a loop as well as a hitch.
xsection.js | 30 Years in Data
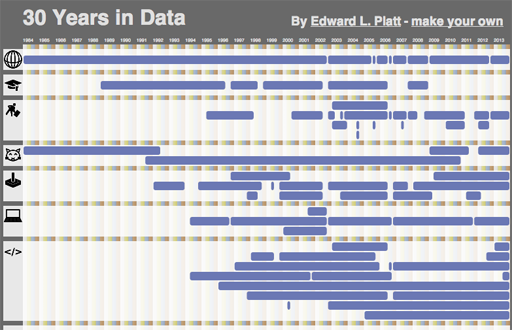
The Earth has, just today, completed revolving around the sun three times for each finger on a typical human hand since the day I was born. To commemorate the occasion, I made an interactive visualization of my life. I've open-sourced the code as xsection.js and you can create your own custom version by modifying the data.js file.
Laminar Flow Fountain
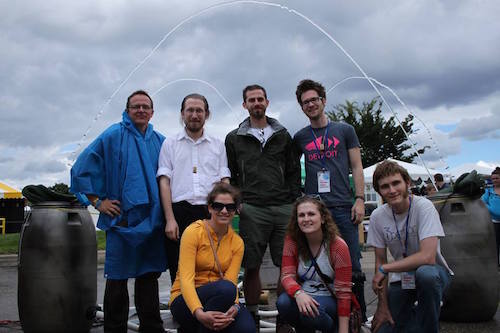
This year at Maker Faire Detroit, I helped Matt Oehrlein and the team from i3 Detroit with their laminar flow fountain. The fountain is composed of three laminar jets. Each jet shoots into a barrel containing the next jet, creating a ring. The individual jets are controlled by an Arduino which wirelessly communicates with a Makey-Makey connected to three brass candle holders. Touching two of the candle holders causes a jet to connect the corresponding two barrels.
Since the project was built in Detroit, and I'm living in Boston these days, I wasn't able to help with the fountain construction. Instead I helped create a "screensaver" demo to show the fountain off when there isn't any activity on the controller. I didn't have access to the electronics when I started because 1. they were in Detroit and 2. they weren't finished yet, so instead I wrote a simulator for the fountain in Processing and worked on it in Boston.
Since the team from i3 was using an Arduino to control the fountain, and the Arduino language is a subset of Processing, I was able to copy my demo code straight from the simulator and into the controller code. You can see the result in the video above, showing the demo running on the fountain with the simulator in the upper right corner.
I wish I could take credit for the fountain itself, because it turned out amazingly well (despite a lot of wind throughout the Faire). The demo was still a lot of fun to work on, and this project now has me thinking about more ways the Arduino/Processing combo can be used for remote collaborations.
Laser Cutter Kerf Gauge
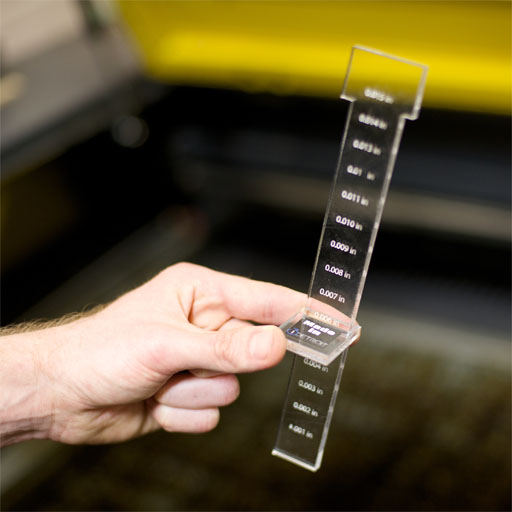
While I was in Michigan over the past week, I got to play with i3 Detroit's new laser cutter (affectionately known as "Bumblebee"). When my friend Roger showed me how to use it, he mentioned that the laser cuts away part of the material, so the finished part will be slightly smaller than it is in the file. This lost material is called the "kerf" of the laser. To complicate matters, the size of the kerf depends on the material being used, and the power settings of the laser. So I thought there would be no better way to acquaint myself with Bumblebee than to measure its kerf.
The most obvious way to measure the kerf is to cut a slot and measure it with a thickness gauge, but we didn't have one. I found a few tutorials online for other ways to measure the kerf. This post on the adafruit blog shows how to measure the kerf by averaging over 10 cuts for greater precision, but still requires a thickness gauge. This instructable shows how to create a 1 inch square test piece that measures the kerf of a single cut with a thickness gauge or caliper. Then I came across another method that let's you measure the kerf without any gauges! I decided to find a way to get the best of both worlds: measuring the kerf over an average of several cuts, without needing a thickness gauge or caliper.
The result was this Kerf Taper Gauge. You simply cut the pattern with your desired material and settings, and drop the gauge through the hole in the tab. When the tapered gauge fits snugly, the taper of the gauge exactly compensates for the kerf, and you can read it off the label on the gauge. The measurement is averaged over 4 cuts: each side of the gauge and each side of the hole.
Next step: find a good way to correct for the kerf...
(Photo credit: Eric Merrill)
Mind Flame
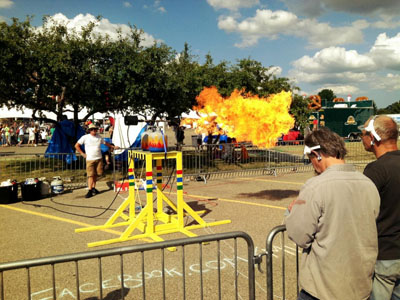
For Maker Faire Detroit this year, I collaborated with Matt Oehrlein to build MindFlame, a mind-controlled flame effect game.
MindFlame uses commercial EEG headsets from NeuroSky to read the brain waves of two contestants. The signal is sent to an arduino, which can determine (more or less) how hard the contestants are focusing. When a contestant focuses hard enough, the arduino activates a solenoid, releasing a burst of propane past a glowfly ignitor, causing a giant burst of flame. The goal was to be the first person to get to four bursts of flame.
This project was tons of fun, and collaborating with Matt was great because we had twice as much time and resources to throw at the project, and I think the end result was much more impressive than we could have done individually. Plus, controlling fire with your mind is just awesome. Josh “Bacon” McAninch (from the Gon KiRin project) helped us with the flame effects, and Maddy "Brodi3" Winans helped us design and decorate the apparatus.
(Photo by Doyle S. Huge)
Mystic Rose Generator
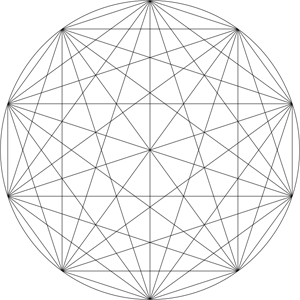
Here's yet another geometric math/art/code thing. It's a javascript-based Mystic Rose Generator. What's a mystic rose? Draw a circle with n evenly spaced points on it and draw a line connecting each point to all the others.
Carabiner Keychain Mod
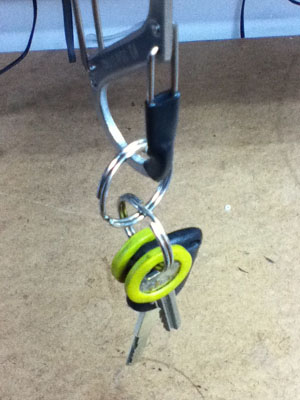
In order to stop losing keys off my carabiner when I unclipped it from my belt, I modded it with some heat shrink tubing. The process is documented on this instructable
