ResourceListener: many endpoints, many requests
While building the new MediaMeter Dashboard tool, the team at the MIT Center for Civic Media faced an interesting design challenge: keeping track of multiple requests to each of multiple API endpoints and rendering views when the right data is ready. For more context, we designed the Dashboard as a front end for the Media Cloud API from Harvard's Berkman Center. We wanted users to be able to enter several searches and compare the results in many different ways (e.g. result count over time, word frequency, text snippets). What's more, we wanted the tool to be extensible, so it was easy to add new visualizations or accommodate new API endpoints. So we're creating a request for every search/endpoint combination, and each visualization could potentially depend on any combination of them. To make all these requests manageable, I augmented backbone.js's built-in events with a ResourceListener class.
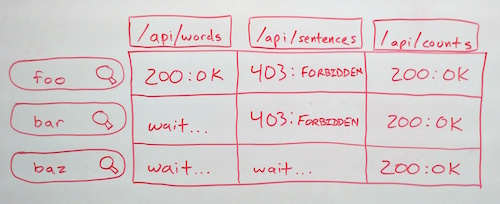
ResourceListener is based on the EventAggregator pattern. A single object aggregates all events related to API requests. All of the different visualizations can then listen to that object for resource-related events, rather than listening to specific models and collections directly. To use the ResourceListener, you need to add a "resourceType" attribute when defining models or collections. Then, after creating the models, simply pass them to the ResourceListener's listen() method. Every time a request is made, the ResourceListener will fire a "request" event and pass the model or collection as a parameter. When the request completes, the ResourceListener will fire a "sync" event, again passing the model as an object. If your only interested in responses from a particular endpoint, you can instead listen to "sync:type" events, where "type" is the "resourceType" attribute of the model or collection. The ResourceListener also fires "resource:complete:type" events when all resources of a particular type are complete, and a "resource:allComplete" when all resources of all types have finished. By passing the ResourceListener object to your views, you can then listen for exactly the events you need, and render as soon as they're complete, without waiting for other requests.
Data Sculpture: Media Perspective
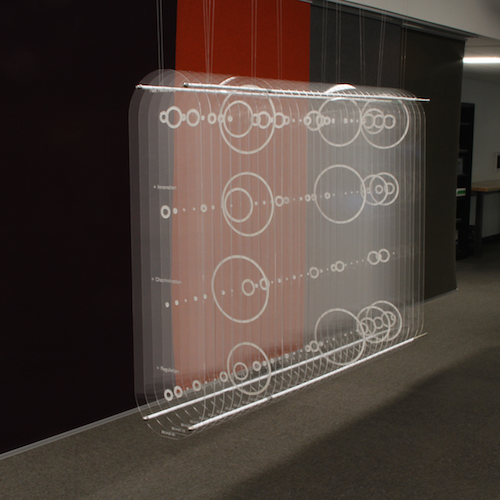
For those of us who work with data, we get used to visualizing in our mind and develop an intuition for it. For everyone else, data visualization usually takes the form of a diagram on a small, two-dimensional screen. Standard data plots can take an exciting idea and turn it into something boring, or even worse, drudge up memories of panicked high school math exams. This experimental data sculpture attempts to draw the viewer into the visualization and connect them with the data on an intuitive, physical level. The sculpture shows the amount of coverage the U.S. mainstream media gave to Net Neutrality between January 2014 and April 2015, while the FCC was creating revised Net Neutrality rules. Each of the 33 panes of clear acrylic represents a two-week time slice, with the size of an etched circle corresponding to the amount of coverage. The top row shows total Net Neutrality coverage, with the other three rows representing coverage of "innovation," "discrimination," and "regulation," in reference to Net Neutrality.
Attention peaks four times: when the FCC announces its proposal, at the end of the public comment period, after President Obama announces support for reclassifying broadband, and finally when the FCC releases its new regulations. Coverage is notably low during the public comment period, the primary time individual citizens had a chance to influence the policy. The visualization also shows that "discrimination," language used in earlier technical and legal discussion of Net Neutrality disappeared from mainstream media coverage, giving way to the more idealogical and economic terms "innovation" and "regulation." The viewer can explore these data by walking around the sculpture, standing back, or standing close, making it easy to engage without a digital interface or specialized knowledge.
Cross-posted to MIT Center for Civic Media
MIT/Knight Civic Media 2014
New Work from the Center for Civic Media from MIT CMS/Writing on Vimeo.
A bunch of spectacular 5 minute updates on 2013—2014 research projects from the Center for Civic Media, where I work. Mine are at 11:00 (What We Watch) and 26:05 (Media Meter), but they're all wonderful.
How to Make Bread
Ed Platt: "How to Make Bread" from MIT CMS/Writing on Vimeo.
I gave an "icebreaker" ignite at the 2014 MIT/Knight Civic Media conference. The theme was "The most interesting thing I learned this year" and I talked about how to culture your own yeast to make bread.
Voip, SMS, and MMS
Here's an outline from my Penguicon 2013 panel "Voip, SMS, and MMS."
Copyright © Edward L. Platt 2011–2024
